For the past year, the Counter-Strike Franchise has seen a dramatic shift. The Source 2 engine has seen major upgrades in the game’s performance and visuals. With the year ended and a new season upon us, I designed a system to evaluate competitive Counter-Strike teams through Elo ratings, focusing on team-play and map scores. I began by developing a Team Elo system using the Chess Rating System and adjusting it to round-weight values, allowing scores to reflect decisive wins or close matches accurately. To account for specific map expertise, I introduced a Map Advantage Weight Value that adjusts expectations based on historical performances. This is particularly effective for maps that had an upset, which would significantly influence the elo outcome.
Data was collected via a Python script that scraped HLTV match results, and a debug process tracked every Elo change for validation. I made monthly charts to visualize performance trends. Notable fluctuations often correlated with roster changes, map pool changes, and tournament outcomes.
The analysis showed a preference for maps such as Ancient and Nuke, which saw the highest play rates. In contrast, Vertigo was picked less frequently, reflecting challenges with its updates and design complexity. This highlights the intricate dynamics of competitive play and map balance. In its entirety, the elo engine and review of data provides a quantitative lens to understand team and map strategies throughout the season.
Designed By: Colin Forbing
Summary:
2024 CS2 Elo Engine
Methodology
Team Elo Generation
I used the traditional constant K-Factoring equation at first, which divides the K factor by the real outcome minus the expected outcome. This favors teams that pull off a major upset while keeping the amount of points obtainable fairly balanced. I also added a round-weight value that increases the amount of points gained/lossed by the number of rounds the winning team won compared to the losing team. This properly calculates a game where there is a heavy deficit in the score.
Map Elo
I made the Team Elo to represent the performance of a team overall while taking a Map Elo to show a more particular perspective of each game. Taking a map that a team plays often and is highly rated will have an advantage against their opponents. This is represented with a Map Advantage Weight, where the expected outcome for the match is weighed into the elo score for the match. I did this because maps picked are correlated to a teams advantageous maps, especially map 1 and map 2 where we have more data. There is also a tradition of dynasties dominating on certain maps with multiple trophy wins like Astralis, FaZe, and Complexity.
Match Format
I used the K-Factor in the equation, or the amount of points gained/lossed, to be adjusted based on the Match Format due to longer Matches in the Best of 3 and Best of 5 format tend to derive more efficient data to a teams overall performance. It also gives more impact to the final stages of events because they are always BO3 or BO5.

Round Weight in Python
Match Format and HLTV Star Rating AssessingData Collection
I built a python script to scrape match data from HLTV, a global news source for Counter-Strike. Getting matches from the Beginning of the Season was difficult at first to gather due to the inconsistencies with match formats, teams playing, and the map pool changing. I was able to establish these differences within the elo to properly assess a team with weight values. I arranged them in sequence of completion to keep track of the progress I was making and to generate a Elo Progression Chart.
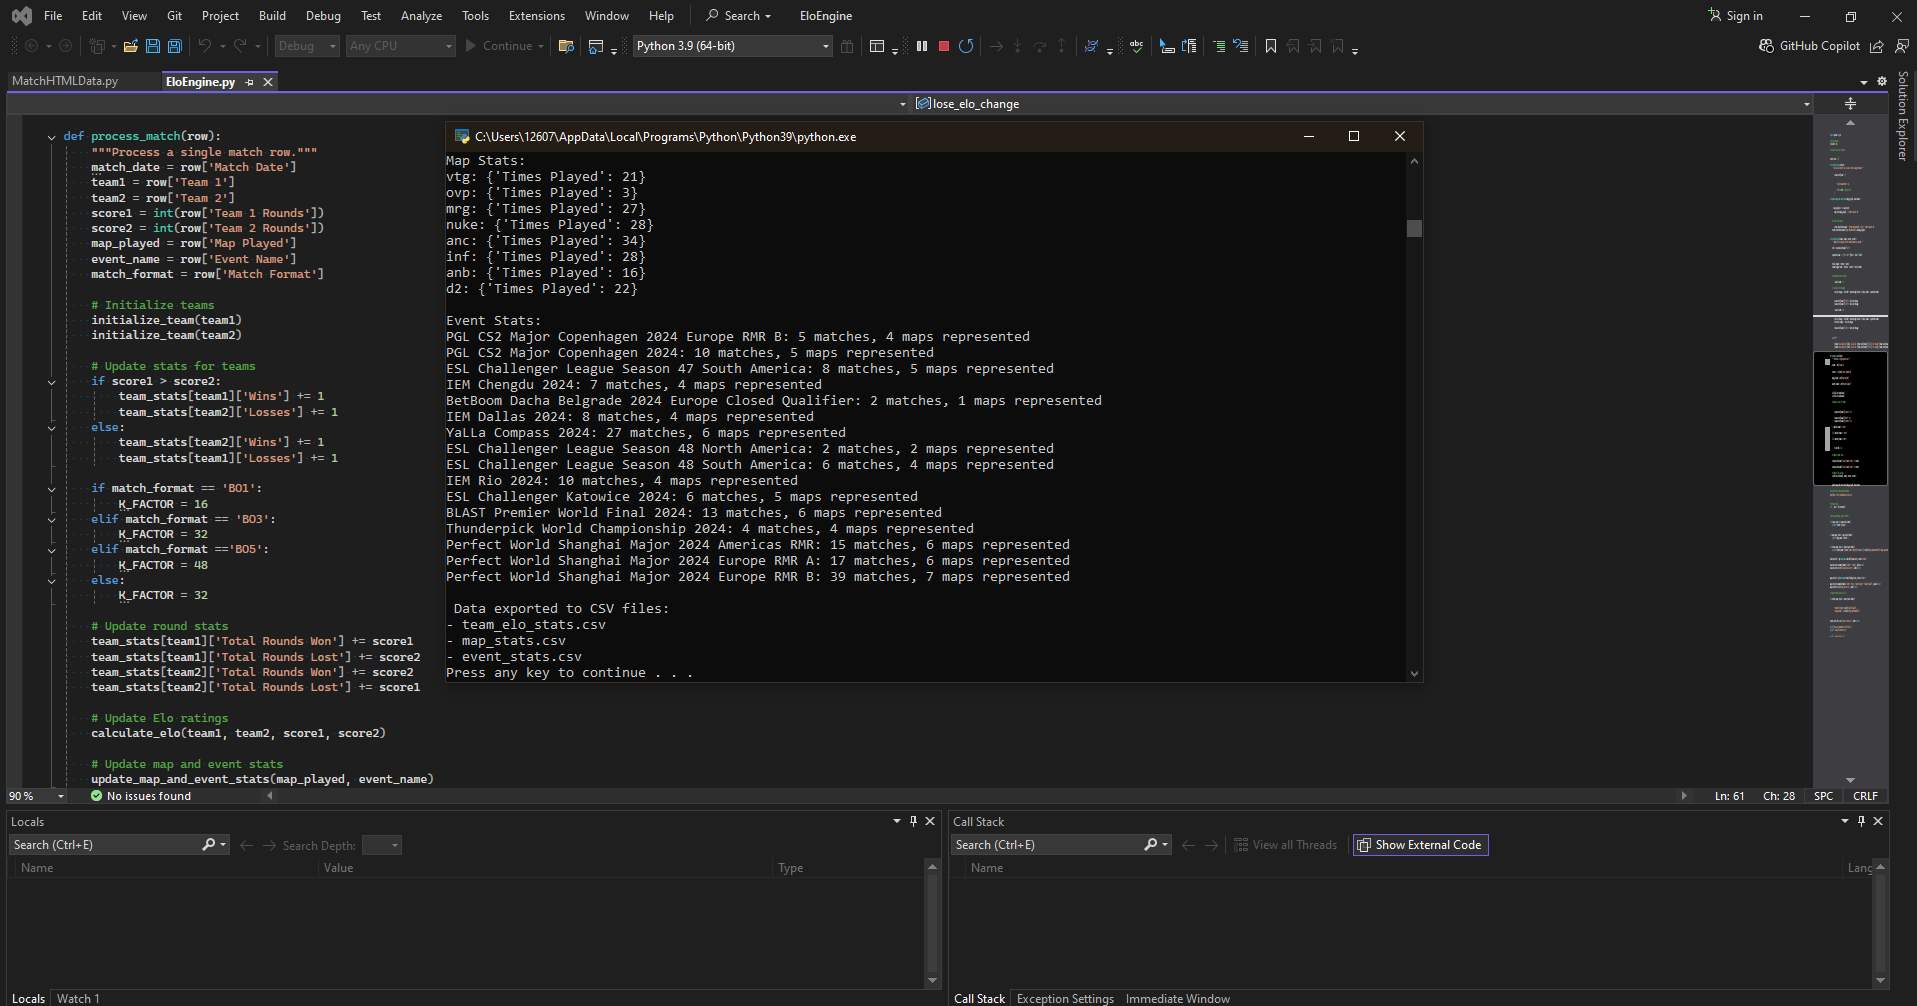
Debugging
For every match, I wrote a debug script that would show the process of importing a match. Everything from the Current Elo, Elo Change, and event information. I did this to properly track the teams trajectory with each match. The Shanghai Major was also occurring while I was working on the engine, so I did compare and contrast the data while watching the live event unfold with the predictions. I even played along in-game with pick ‘ems by running the engine with the games played, predicting who would win. (I got a gold medal in pick ‘ems just because I missed the first deadline)
Monthly Chart
Over the months recorded, Every new team entered into the database starts at 1000 elo then the results of the recorded match is applied. I then assigned a monthly elo to each of the teams that played, with the first day of the month finalizing their progression. Taking this data can easily show the peaks of performance and progression by making a chart to visualize the average elo throughout the months.
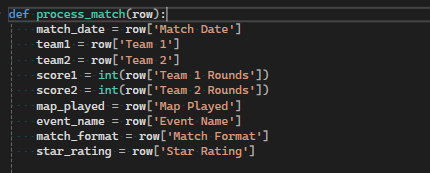
process_match analyzes each match in the database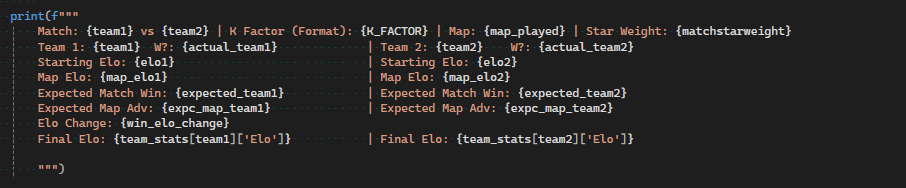
Debugging print text in PythonMonthly Data Chart
Team Vitality seen the most time in first, but there are many other teams at play. There were a few surprises with Virtus.Pro dipping below 1000 elo for multiple months. Complexity dipped below 900 elo in May, but surged back up to 1029 in 2 months. HEROIC was consistently making 1050 elo but dropped more on the average rather than grow with the other organizations, like The MongolZ, Spirit, and Natus Vincere. From analyzing this data, It helps correlate with the results of tournaments and roster changes throughout the year.

Top Insights
-
Vitality - 1279.83
Spirit - 1245.02
G2 - 1237.92
The MongolZ - 1200.05
FaZe - 1175.395
-
Vitality - 6
Spirit - 3
G2 - 1
FaZe - 1
MOUZ - 1
-
ESL Pro League 19 - 193 Maps Played
ESL Pro League 20 - 189 Maps Played
Perfect World Shanghai 2024 - 126 Maps Played
PGL Copenhagen 2024 - 117 Maps Played
IEM Katowice 2024 - 72 Maps Played
-
*Me: Map Elo
Vertigo - Complexity (1157.74 Me)
Nuke - SAW (1131.35 Me)
Anubis - Complexity (1106.06 Me)
Ancient - Liquid (1162.45 Me)
Overpass - Spirit (1116.33 Me)
Mirage - Astralis (1081.33 Me)
Dust 2 - Virtus.Pro (1112.60 Me)
Inferno - FaZe (1115.08 Me)
-
1 - Teams between 1250-1300 elo
3 - Teams between 1200-1250 elo
5 - Teams between 1150-1200 elo
2 - Teams between 1100-1150 elo
3 - Teams between 1050-1100 elo
13 - Teams between 1000-1050 elo
47 - Teams between 950-1000 elo
14 - Teams between 900-950 elo
6 - Teams between 850-900 elo
Ranking Chart

Sorted by Descending Avg Monthly EloMap Pool
The most played map was Ancient at 333 and Nuke close behind with 328. These two maps have a major impact on the scene. I've always enjoyed these maps because of how entertaining the matches can be. The map played the least was Overpass but was also taken out of the pool for Dust 2 early in the year with the last match taking place on May 10th.
Dust 2 is a classic CS map from the beginning of the franchise with a straightforward Four-Leaf Clover Design. Overpass is notorious for longer matches because the design supports a staggering approach to attacking a bombsite, rather than the fast-paced flash-n-go like Dust 2. Vertigo isn’t far behind in the pick rate, even though it was a map that updated with CS2. If you put the pick rate of Dust 2 and Overpass together, Vertigo would be in last place by 70 picks.
I believe this is strongly indicative of the negative sentiment held by the community over Vertigo's persistent updates and inclusion in the competitive map pool. The rate of picks for Overpass over Vertigo at the beginning of the year shows that Overpass is more comfortable for teams. The design of Overpass is also asymmetrical and provides unique level interactions like Vertigo does.
Train was recently introduced to the game and has seen positive feedback for the design and visuals. The new Train design is replacing Vertigo in the map pool for 2025, which was my first conclusion from the data. Inferno is another candidate even though its history is longer than Vertigo but the map strategy has been exhausted. The negative sentiments prevail for the narrow hallways and bombsite rotations, making a majority of rounds harder to prevent snowballing in the economy. I would suggest removing Inferno from the Map Pool too, given that the data supports the changes and with Train replacing Vertigo already at the beginning of the year. Overpass could be re-introduced to the pool but other beautiful maps are in the works right now and could have a better potential to fill that role, like Cache, Cobblestone, and Thera.
Maps Played
- Vertigo
- Anubis
- Overpass
- Mirage
- Inferno
- Ancient
- Nuke
- Dust 2
- Vertigo
- Anubis
- Overpass
- Mirage
- Inferno
- Ancient
- Nuke
- Dust 2
Events Recorded
I recorded a total of 47 tournaments across the year. The two biggest tournaments were the ESL Pro League Seasons 19 & 20. With a 20% of the data being in the two Seasons, I collected as many LANs as possible from the Elisa Masters Espoo to Fragadelphia 18. Through all the tournaments, a majority had a match on every map, but near the end of the year, the maps played started to shrink.
I was also surprised to see how many finals weren’t a Best of 5 (BO5) as my assumption was that Finals are always BO5 and Semi-Finals are mostly BO3. There were only 11 BO5s recorded throughout the year. The Best of 5 Match Format tends to test a teams consistency and resilience. The storylines made in a BO5 are beautifully written by the production team and tend to create moments in CS History. The Best of 3 Format tends to test a teams map pool and quick strategy. Teams are afforded more strategy in the map pick and ban phase and quality engagements can be made with the players. The Best of 1 Format can’t always provide that benefit because a single game decides who gets the match win. The amount of nuance in Counter-Strike allows fresh teams to overwhelm their veteran opponents with the right timing, teamwork, and some luck. I am happy with the format and resulting competitiveness of Major tournaments with the RMR format, but with the upcoming changes, I am unsure of how teams would be measured against each other in the future.
My favorite events this year were PW Shanghai, IEM Dallas, BLAST World Final, and Blast Fall Finals. Each of these events had amazing games going on in each part of the tournament. From The MongolZ making their Major Run in Shanghai or G2 “mopping the floor” at the Blast World Finals.
Events by Maps Played
- BLAST Premier Spring Groups 2024
- IEM Katowice 2024 Play-in
- IEM Katowice 2024
- PGL CS2 Major Copenhagen 2024 Europe RMR A
- PGL CS2 Major Copenhagen 2024 Europe RMR B
- PGL CS2 Major Copenhagen 2024 Americas RMR
- PGL CS2 Major Copenhagen 2024
- ESL Challenger League Season 47 South America
- IEM Chengdu 2024
- BetBoom Dacha Belgrade 2024 Europe Closed Qualifier
- Global Esports Tour Rio 2024
- ESL Pro League Season 19
- ESL Challenger Melbourne 2024
- BetBoom Dacha Belgrade 2024
- IEM Dallas 2024
- ESL Pro League Season 20
- YaLLa Compass 2024
- Blast Premier Spring Final 2024
- ESL Challenger Jonkoping 2024
- FiReLEAGUE 2024 Global Finals
- Esports World Cup 2024
- Skyesports Championship 2024
- Blast Premier Fall Groups 2024
- IEM Cologne 2024 Play-in
- Perfect World Shanghai Major 2024